Mapping sensations: Difference between revisions
(Created page with "<div style=" font-family: courier new, monospace; font-size: 14px; "> == <span style="color: white; font-family: Menlo; text-decoration:none; background-color: #0033ff; padding-top: 0.1vw; padding-bottom: 0.1vw; padding-left: 0.1vw; padding-right: 0.2vw;"> _context</span>== Creating maps is always subjective. As Ruben Pater argues in his book ''The Politics of Design'', The notion that maps provide an objective or scientific depiction of the world is a common myth....") |
|||
| (23 intermediate revisions by the same user not shown) | |||
| Line 6: | Line 6: | ||
== <span style="color: white; font-family: Menlo; text-decoration:none; background-color: #0033ff; padding-top: 0.1vw; padding-bottom: 0.1vw; padding-left: 0.1vw; padding-right: 0.2vw;"> _context</span>== | == <span style="color: white; font-family: Menlo; text-decoration:none; background-color: #0033ff; padding-top: 0.1vw; padding-bottom: 0.1vw; padding-left: 0.1vw; padding-right: 0.2vw;"> _context</span>== | ||
<span style="color: black; background-color: #DCDCDC; padding-top: 0.1vw; padding-bottom: 0.1vw; padding-left: 0.1vw; padding-right: 0.2vw;">_work in progress_</span> | |||
<br> | |||
Creating maps is always subjective. As Ruben Pater argues in his book ''The Politics of Design'', | Creating maps is always subjective. As Ruben Pater argues in his book ''The Politics of Design'', | ||
| Line 11: | Line 13: | ||
<br> | <br> | ||
Not to mention that each map is created by someone, whose perspective is different: his (at least in the times when cartography was established, we have only male names recorded) point of view, his location on the globe and his needs to record some places and routes. The distortions of the map as we know it (the most common map used is the highly distorted ''Mercator map'', made by Gerardus Mercator in 1569) are quite visible on the other tries of making a more accurate depiction: the ''Winkel Tripel'' projection (1921) and the ''Gall-Peters'' projection map (1973). | Not to mention that each map is created by someone, whose perspective is different: his (at least in the times when cartography was established, we have only male names recorded) point of view, his location on the globe and his needs to record some places and routes. The distortions of the map as we know it (the most common map used is the highly distorted ''Mercator map'', made by Gerardus Mercator in 1569) are quite visible on the other tries of making a more accurate depiction: the ''Winkel Tripel'' projection (1921) and the ''Gall-Peters'' projection map (1973). | ||
<br> | <br><br> | ||
Thus, in my work with mapping, i am approaching the matter with high subjectivity. Why not use mapping as a tool to visualise and record things the way we see them - with the full awareness that it is our intention? For my new visual series <mapping sensations/>, i decided to experiment by mapping things i feel. It all started when i tried to explain my long-covid mysterious symptoms to a number of doctors in two languages. At some point, i had to find a way to describe it as clearly as possible, and to remember the key elements, so i don’t miss an important symptom or data around it. For it, i drew a map of my symptoms in my notebook and went with it at the doctor’s appointments. Only to realise, if the doctor is not someone who will listen and pay attention to what i am saying, it is a complete waste of energy. However, that helped me to track the development of the symptoms and to understand where in my body they are (or at least to have a better guess). | Thus, in my work with mapping, i am approaching the matter with high subjectivity. Why not use mapping as a tool to visualise and record things the way we see them - with the full awareness that it is our intention? For my new visual series <mapping sensations/>, i decided to experiment by mapping things i feel. It all started when i tried to explain my long-covid mysterious symptoms to a number of doctors in two languages. At some point, i had to find a way to describe it as clearly as possible, and to remember the key elements, so i don’t miss an important symptom or data around it. For it, i drew a map of my symptoms in my notebook and went with it at the doctor’s appointments. Only to realise, if the doctor is not someone who will listen and pay attention to what i am saying, it is a complete waste of energy. However, that helped me to track the development of the symptoms and to understand where in my body they are (or at least to have a better guess). It also made me realise that i am in a moment of my life, that i fully understand the limitation of doctor's knowledge, experience and ability to deal with my problem - that i need to collect information, process it, and take my own decision of how to handle my treatment. Parted with my childish belief that they can always find what it is and give me a medical treatment which is designed for this particular condition. It’s a team work with the patient - so it makes sense to find a doctor who is a good team player. | ||
<br><br> | |||
As a result of this experiment, i decided to go on trying to map the way i feel about things. In such an introspective period that i am now, it is the only way i feel i am able to express the mix of thoughts & feelings that bother me. Putting them on paper, canvas or digital drawing, helps me acknowledge and release them and to move on. | |||
== <span style="color: white; font-family: Menlo; text-decoration:none; background-color: #0033ff; padding-top: 0.1vw; padding-bottom: 0.1vw; padding-left: 0.1vw; padding-right: 0.2vw;"> _works</span>== | |||
=== <span style="color: black; background-color: #DCDCDC; padding-top: 0.1vw; padding-bottom: 0.1vw; padding-left: 0.1vw; padding-right: 0.2vw;">where i am (not) </span> === | |||
[[File:Where i am (not).jpg|thumb|wip of "Where I am (not)" // digital artwork 4000x4000px]] | |||
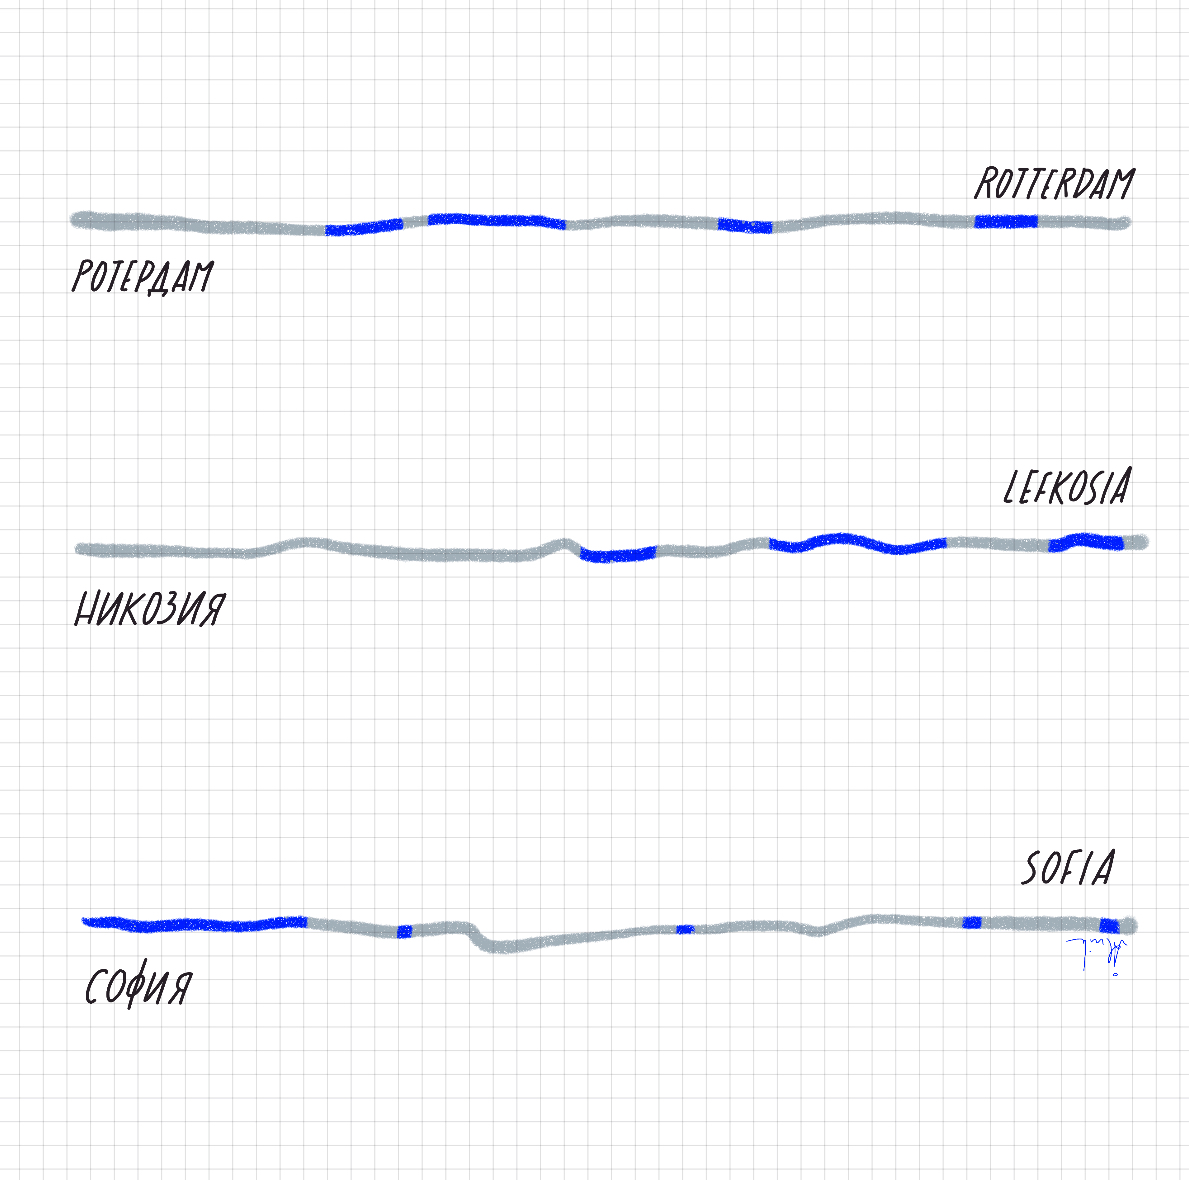
For my trip from the Netherlands to Cyprus, I took a Transavia direct flight. We flew exactly above Sofia, just passed by above my home city. I was looking at it for some minutes and was thinking of all of my family and friends who are there right at that moment. But I couldn't see them, I couldn't see anything that was happening there. Was anything happening there at all if I am not there to see it? Of course. I imagined my places around Europe as timelines of events, lives, things that were happening all the time. But for me, things only happen, they only have colour while I am there. All the other time is passive for me, invisible, grey. I felt the need to illustrate that. This is how this "map" was born. Map of missed and caught timelines, moments and colours. | |||
▶▶ [https://alnik.me/where-i-am-not see the work here]<br> | |||
▶▶ [https://alnik.me/shop/-where-i-am-not-digital-artwork collect it on my webshop]<br> | |||
=== <span style="color: black; background-color: #DCDCDC; padding-top: 0.1vw; padding-bottom: 0.1vw; padding-left: 0.1vw; padding-right: 0.2vw;">people in (my) life </span> === | |||
[[File:People in (my) life.jpg|thumb|people in (my) life // 30x30 cm // acrylic on canvas // 2024]] | |||
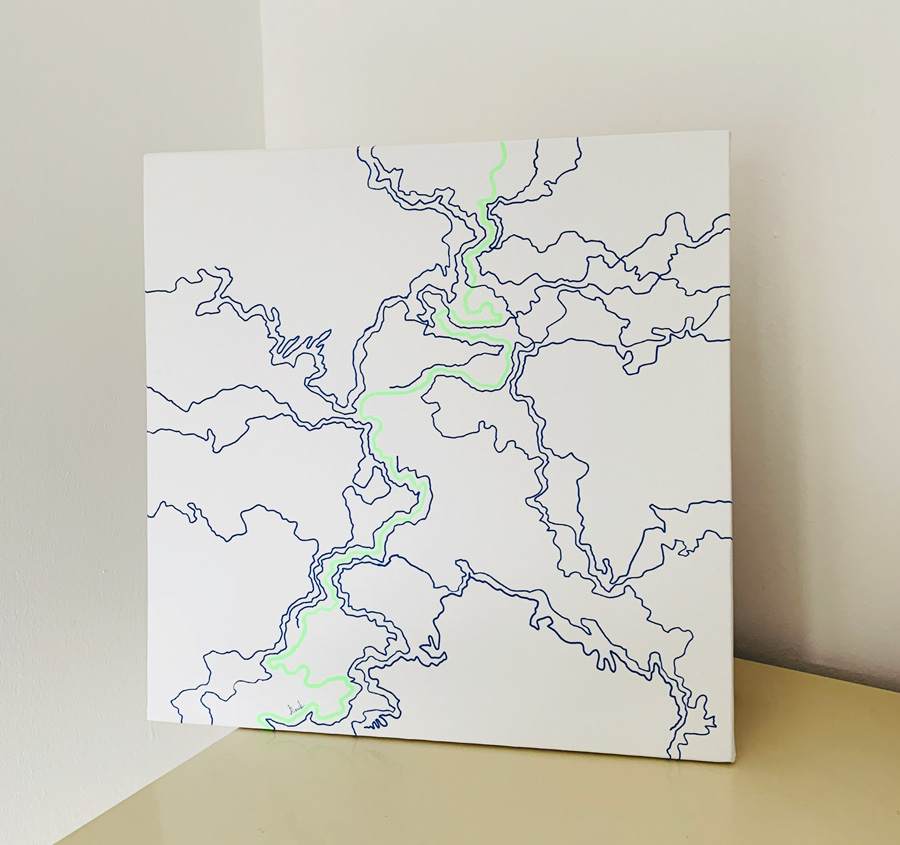
This mapping experiment approaches people's lives as lines. Whilst the centre line (in neon green) is the protagonist's lifeline, the blue ones are the people who enter and exit one's life in different moments. In the first sketch, I tried mapping entrance and exit of people only without any overlapping. However, when I started drawing the canvas, I felt that even in this simplified version, people's interactions are usually entangled at some point. Thus, here we can see people who meet in different periods of their lives, people being born later, people who die, etc. | |||
// This work is available for purchasing, current location: Nicosia (CY). | |||
=== <span style="color: black; background-color: #DCDCDC; padding-top: 0.1vw; padding-bottom: 0.1vw; padding-left: 0.1vw; padding-right: 0.2vw;">breathe [pranayama] </span> === | |||
[[File:Breathe.jpg|thumb|breathe [pranayama] // 15x15cm // acrylic on canvas // 20-2-2024]] | |||
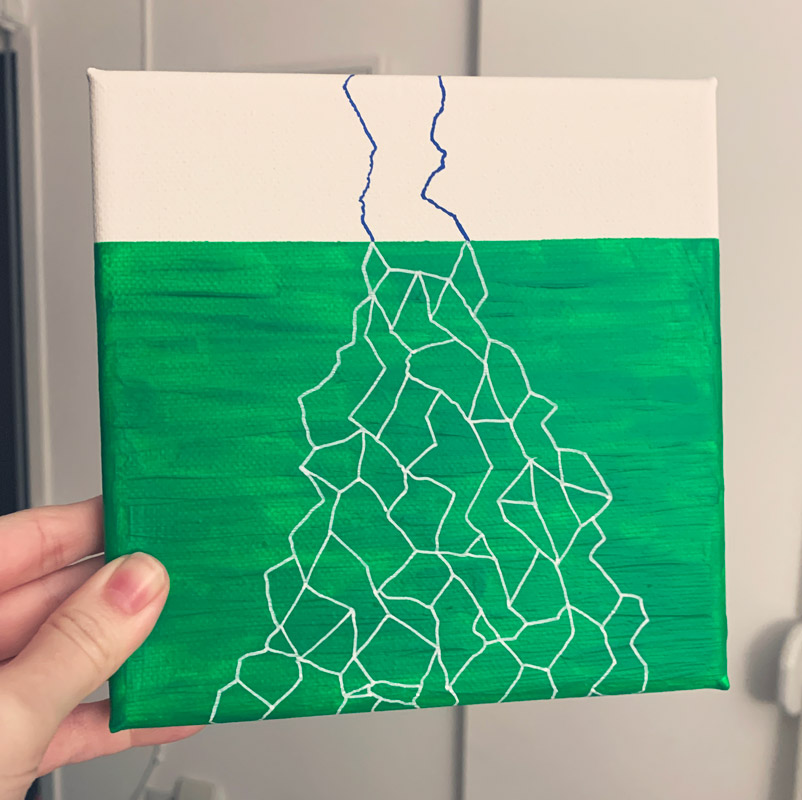
Another mapping experiment while reading about breathing in yoga. The concept of prana and the places where there is more of it (such as shores, waterfalls, forests) and less of it if any (closed rooms, cities) reminded me of the notion of fresh air. And its invisibility - the energy that you get from clean places is invisible, but when it gets inside your body, it brings freshness and stamina. This is what this little experiment illustrates. | |||
// This work is available for purchasing, current location: Nicosia (CY). | |||
=== <span style="color: black; background-color: #DCDCDC; padding-top: 0.1vw; padding-bottom: 0.1vw; padding-left: 0.1vw; padding-right: 0.2vw;">body glitches </span> === | |||
[[File:Body glitches.jpg|thumb|<body glitches/> // digital art // 2024]] | |||
Between November 2023 and January 2024, I had a series of spasms in the area of the heart/stomach which happened usually while I was walking on the street. Those deeply disturbing symptoms were so regular, that did not allow me to walk much, not to mention do any kind of sports. After visiting several doctors, doing many medical checks, no doctor could have found the reason for those spasms. Thus, I had to deal with them on my own and find my own way to heal. After experimenting and self-researching, I figured it was something connected to my gullet and stomach, hence my GERD illness (gastroesophageal reflux disease). | |||
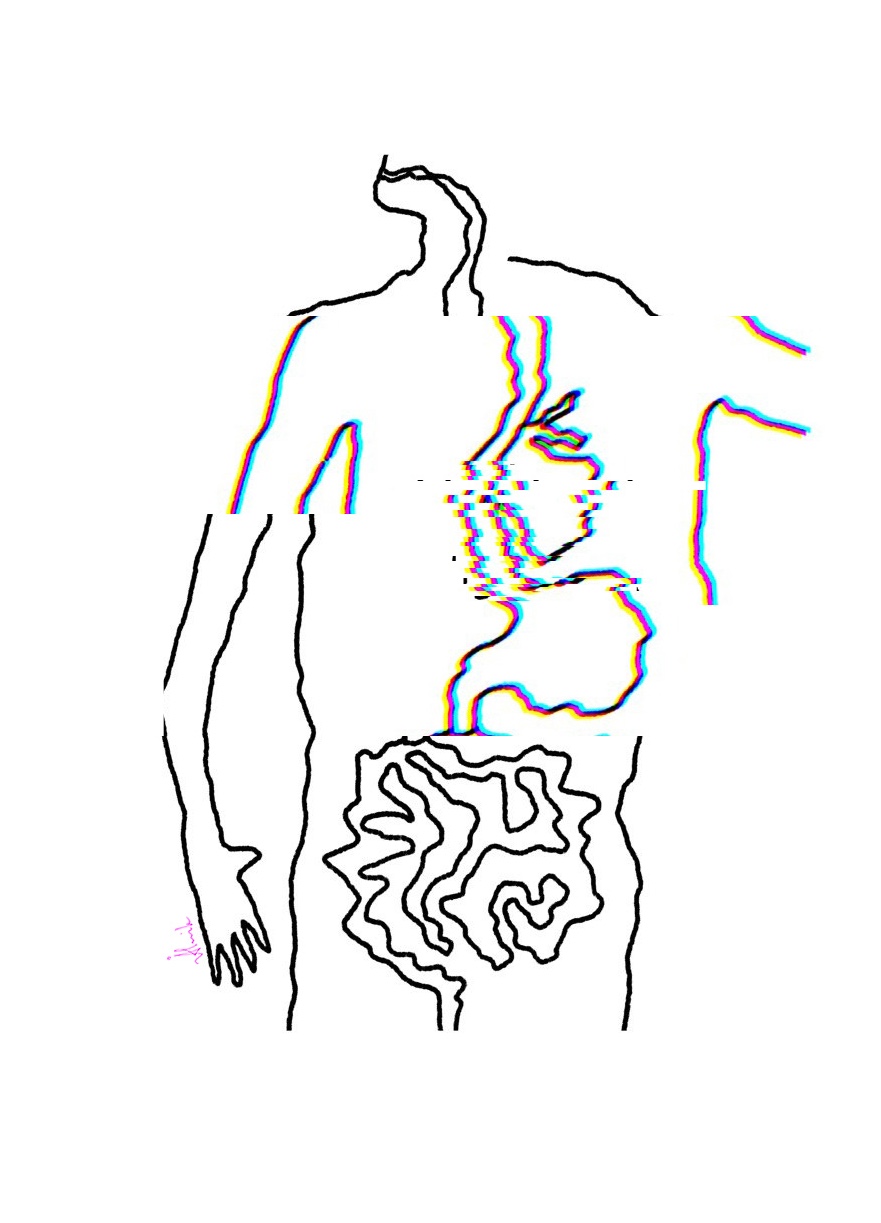
Reflecting on that experience, frustrated for not being able to understand what exactly caused them and why they stopped, I see them now as glitches. I was trying out different ways to visualise them, to explain them - to myself, to the doctors. But no illustration felt right until I saw them as bugs, as errors, as malfunctions, as tired code, as glitches, when the body's system is blocked somewhere and the balance is disturbed. The digital artwork is the result of my experiment of mapping those spasms [see right]. | |||
// digital art // 2024 | |||
== <span style="color: white; font-family: Menlo; text-decoration:none; background-color: #0033ff; padding-top: 0.1vw; padding-bottom: 0.1vw; padding-left: 0.1vw; padding-right: 0.2vw;"> _references & inspirations</span>== | == <span style="color: white; font-family: Menlo; text-decoration:none; background-color: #0033ff; padding-top: 0.1vw; padding-bottom: 0.1vw; padding-left: 0.1vw; padding-right: 0.2vw;"> _references & inspirations</span>== | ||
★ Евтимов, В. ''Йога.'' София (1981) <br> | |||
★ Kollektiv Orangotango and Transcript (Firm (2019). ''This is not an atlas : a global collection of counter-cartographies.'' Bielefeld: Transcript Verlag. <br> | |||
★ Pater, R. (2016). ''Politics of Design : A (Not So) Global Manual for Visual Communication.'' Amsterdam: Bis Publishers. | ★ Pater, R. (2016). ''Politics of Design : A (Not So) Global Manual for Visual Communication.'' Amsterdam: Bis Publishers. | ||
Latest revision as of 14:01, 24 June 2024
_context
_work in progress_
Creating maps is always subjective. As Ruben Pater argues in his book The Politics of Design,
The notion that maps provide an objective or scientific depiction of the world is a common myth. The graphic nature of maps simplifies reality, giving makers and users a sense of power without social and ecological responsibilities. Details like the colouring of areas or the different sizes in typography can have great political consequences.
Not to mention that each map is created by someone, whose perspective is different: his (at least in the times when cartography was established, we have only male names recorded) point of view, his location on the globe and his needs to record some places and routes. The distortions of the map as we know it (the most common map used is the highly distorted Mercator map, made by Gerardus Mercator in 1569) are quite visible on the other tries of making a more accurate depiction: the Winkel Tripel projection (1921) and the Gall-Peters projection map (1973).
Thus, in my work with mapping, i am approaching the matter with high subjectivity. Why not use mapping as a tool to visualise and record things the way we see them - with the full awareness that it is our intention? For my new visual series <mapping sensations/>, i decided to experiment by mapping things i feel. It all started when i tried to explain my long-covid mysterious symptoms to a number of doctors in two languages. At some point, i had to find a way to describe it as clearly as possible, and to remember the key elements, so i don’t miss an important symptom or data around it. For it, i drew a map of my symptoms in my notebook and went with it at the doctor’s appointments. Only to realise, if the doctor is not someone who will listen and pay attention to what i am saying, it is a complete waste of energy. However, that helped me to track the development of the symptoms and to understand where in my body they are (or at least to have a better guess). It also made me realise that i am in a moment of my life, that i fully understand the limitation of doctor's knowledge, experience and ability to deal with my problem - that i need to collect information, process it, and take my own decision of how to handle my treatment. Parted with my childish belief that they can always find what it is and give me a medical treatment which is designed for this particular condition. It’s a team work with the patient - so it makes sense to find a doctor who is a good team player.
As a result of this experiment, i decided to go on trying to map the way i feel about things. In such an introspective period that i am now, it is the only way i feel i am able to express the mix of thoughts & feelings that bother me. Putting them on paper, canvas or digital drawing, helps me acknowledge and release them and to move on.
_works
where i am (not)
For my trip from the Netherlands to Cyprus, I took a Transavia direct flight. We flew exactly above Sofia, just passed by above my home city. I was looking at it for some minutes and was thinking of all of my family and friends who are there right at that moment. But I couldn't see them, I couldn't see anything that was happening there. Was anything happening there at all if I am not there to see it? Of course. I imagined my places around Europe as timelines of events, lives, things that were happening all the time. But for me, things only happen, they only have colour while I am there. All the other time is passive for me, invisible, grey. I felt the need to illustrate that. This is how this "map" was born. Map of missed and caught timelines, moments and colours.
▶▶ see the work here
▶▶ collect it on my webshop
people in (my) life
This mapping experiment approaches people's lives as lines. Whilst the centre line (in neon green) is the protagonist's lifeline, the blue ones are the people who enter and exit one's life in different moments. In the first sketch, I tried mapping entrance and exit of people only without any overlapping. However, when I started drawing the canvas, I felt that even in this simplified version, people's interactions are usually entangled at some point. Thus, here we can see people who meet in different periods of their lives, people being born later, people who die, etc.
// This work is available for purchasing, current location: Nicosia (CY).
breathe [pranayama]
Another mapping experiment while reading about breathing in yoga. The concept of prana and the places where there is more of it (such as shores, waterfalls, forests) and less of it if any (closed rooms, cities) reminded me of the notion of fresh air. And its invisibility - the energy that you get from clean places is invisible, but when it gets inside your body, it brings freshness and stamina. This is what this little experiment illustrates.
// This work is available for purchasing, current location: Nicosia (CY).
body glitches
Between November 2023 and January 2024, I had a series of spasms in the area of the heart/stomach which happened usually while I was walking on the street. Those deeply disturbing symptoms were so regular, that did not allow me to walk much, not to mention do any kind of sports. After visiting several doctors, doing many medical checks, no doctor could have found the reason for those spasms. Thus, I had to deal with them on my own and find my own way to heal. After experimenting and self-researching, I figured it was something connected to my gullet and stomach, hence my GERD illness (gastroesophageal reflux disease).
Reflecting on that experience, frustrated for not being able to understand what exactly caused them and why they stopped, I see them now as glitches. I was trying out different ways to visualise them, to explain them - to myself, to the doctors. But no illustration felt right until I saw them as bugs, as errors, as malfunctions, as tired code, as glitches, when the body's system is blocked somewhere and the balance is disturbed. The digital artwork is the result of my experiment of mapping those spasms [see right].
// digital art // 2024
_references & inspirations
★ Евтимов, В. Йога. София (1981)
★ Kollektiv Orangotango and Transcript (Firm (2019). This is not an atlas : a global collection of counter-cartographies. Bielefeld: Transcript Verlag.
★ Pater, R. (2016). Politics of Design : A (Not So) Global Manual for Visual Communication. Amsterdam: Bis Publishers.


